|
Sociology 1301
|
“Thinking Caps” |
As I mentioned in the course overview, when I attended grade school back in Brooklyn, New York – I’m approaching 70-years old so this was back in the 1950’s – I distinctly remember teachers, in their attempts to encourage us, asking us to “put our thinking caps on.” Being eight years old I never thought much about it, but twenty years later while a graduate student in Sociology at Columbia University I stumbled upon the actual source. |
Herbert Butterfield 1900 - 1979 |
|
Throughout the semester, I will be asking you to do this. I will be trying to convince you that sociology is a “way of seeing and thinking” about things – that it entails putting on a new “thinking cap.” I will ask you to think hard about your life, your relationships, your local environment, the larger society in which you live, and the world and to take this same bundle of data that you think you know or that you tend to take for granted and see them in a different way. |
C. Wright Mills Columbia University 1916 - 1962 |
|
But let me be clear right from the start: Sociology is not the only perspective that can fruitfully be applied to human action – the disciplines of biology, psychology, economics, political science, anthropology, even theology also take human beings as their subject matter – and each of these perspectives contributes in important ways to our understanding of who we are and why we do the things that we do. As we shall see, each discipline carves out its own niche and typically focuses on different aspects of human life. They are not competing with one another to find the absolute “truth,” they are simply following different paths, each focused upon a piece of the puzzle. So before we actually begin talking about sociology – what it is and how it will help deepen our understanding of both our personal experiences and the world-at-large – it’s important that we first consider both the strengths and the limitations of all ways of thinking – no matter what the subject matter! We will begin, then, with a focus on what a “perspective" is and how people use them whether they are aware of it or not – and, by the way, most often they are not aware of using them – and the roles that they play. So, let’s begin. What, exactly, do we mean by the term “perspective?” According to the Oxford Dictionary of the English Language, the term perspective originated in the developing science of optics. A perspective was something that was used for looking or viewing something – its function was to assist seeing what was there. Then, the meaning of perspective morphed – or shifted – and was now referred to as seeing something from a particular “point of view.” Soon after, scholars recognized that since different perspectives focus upon different aspects of the same phenomenon, no one perspective could fully describe or account for what is being seen. It’s not that what a perspective focuses your attention upon and aids you in seeing is wrong or incorrect – it’s just incomplete. |
|
|
And this is important: Perspectives, points of view, will both facilitate – make easier – and constrain – make more difficult – what you perceive in the world. |
The “Burke Theorem”: |
Kenneth Burke 1897 - 1993 |
|
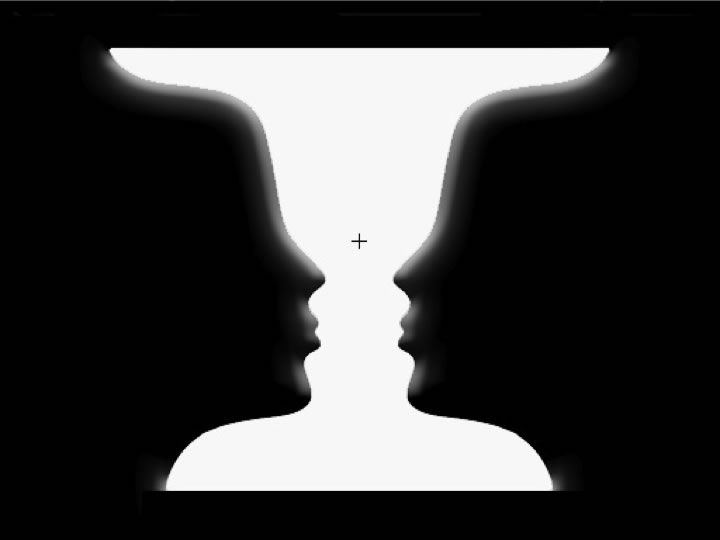
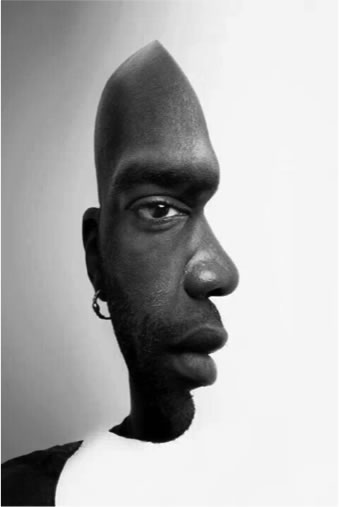
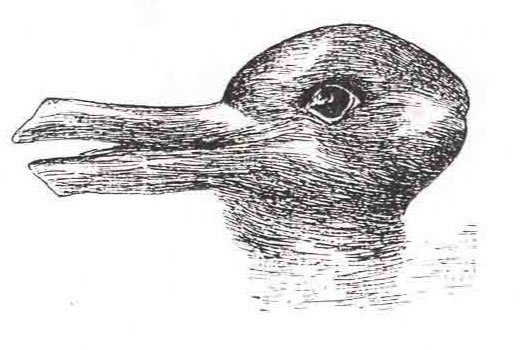
On the one hand, this is a basic fact of how our brains are wired and how “attention” affects “perception.” For examples, look at the next four images – some of them are probably familiar to you. |
|
|
|
|
S |
Which figure jumps out at you? The young woman or the old woman? If you don’t yet see both, the old woman’s head is much larger and notice that her chin is the young girl’s neck, her lips, the young girl’s necklace, her nose, the young girl’s chin and jawline. Again, you cannot see both simultaneously – focusing on one precludes you seeing the other at the same time. As shall be seen later, what is also interesting here is that which of the two figures you see first depends on the perspective guiding your vision. And the perspective you hold is often affected to a large degree by social factors such as your age, sex, social class, race, and a whole host of other things. It should come as no surprise, then, to find out that, generally speaking, older folks see the old woman first, younger folks tend to see the younger woman first. This last point – that the perspective you embrace guides your perception – can also be illustrated by the next figure. |
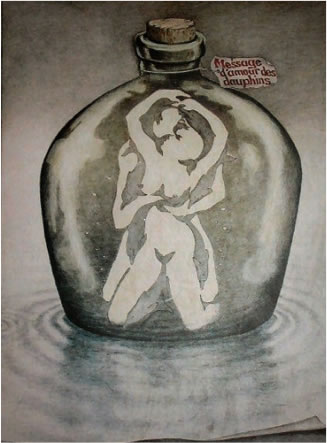
For some, this might seem somewhat pornographic. But look again: young children will typically only see all of the dolphins frolicking about! I’ll give you another few moments to see them before moving on . . . Before moving on, let me show you a famous example of what psychologists call selective perception. Click on this brief video and you’ll see how a way of seeing is also a way of not seeing. |
OK. Maybe you did see the gorilla the first time. So now look at this one. |
Now, the main point I am trying to get you to consider is that a great many perspectives exist in the world – that there is a huge variety of ways we can examine the world – that there are different points of view – and that each one can potentially contribute something important to our understanding. One is not necessarily “better” or “more true” than the others, each has a legitimate though different point of view. These perspectives are not in conflict with one another in the sense that if one is right the other is wrong. They are best seen, instead, as complementary and mutually enriching. |
Our tendency, however, is to get locked into one particular perspective and by doing so, fail to see these other legitimate points of view. |
|
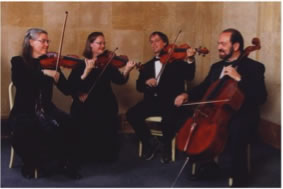
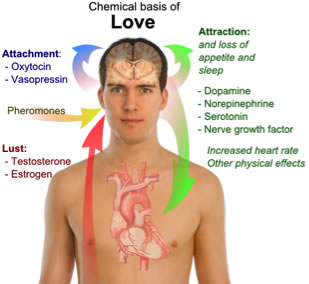
Yes, the bow is made out of horses’ tails and, yes, the strings of a violin and other string instruments are made of catgut. But it is also true that listening to Beethoven can be a profoundly exhilarating experience and described in equally valid terms. But let me make this point that different perspectives, by focusing upon different aspects of the same phenomenon, each have interesting things to say, by having you consider something you probably have experienced at some point in your life – or certainly will experience some day - kissing. |
The Plurality of Perspectives: The Science of Kissing |
Sheril Kirshnbaum University of Texas-Austin |
|
Jonathan Swift 1667 - 1745 |
|
Sigmund Freud 1856 - 1939 |
|
Albert Einstein 1879 - 1955 |
|
|
But the Popes and emperors, citing health reasons, weren’t far off base. According to microbiologists, kissing is the best means for two people to swap mucus, viruses, bacteria, and other germs. Our saliva contains about one hundred million bacteria per milliliter (about the size of one die in a pair of dice). I find it interesting that, generally speaking, when someone is asked whether they would use someone else’s toothbrush – even their partner’s – they grimace and mutter “that’s disgusting.” These same people, of course, think nothing of kissing their partner – or even someone on a first date who is virtually a stranger! It does make you stop and wonder . . . |
|
|
|
|
While all this is undoubtedly true, the kiss, of course, is also a quintessential social act: it’s not quite the same if you are alone! But you might not know that the act of kissing is a rather complicated social act that occurs under many circumstances with many different cultural meanings and functions. Kissing – or what is interpreted as kissing – though not universal in the animal kingdom – is fairly abundant. |
But kissing is, in fact, found in over 90% of the cultures around the world and in those where it is not found there is typically licking or nibbling one another’s faces and bodies or rubbing noses. And if there is a deep biological basis for kissing-like behaviors, culture is the central factor determining precisely what form a kiss takes at a particular time and place. Peoples of different cultures have developed unique social norms that shape and guide this behavioral act. This is where anthropology, history, and sociology have much to offer. |
Edward B. Tylor 1832 - 1917 |
|
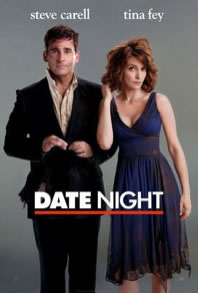
All kisses, of course, are not alike. They have different functions. It can be a simple greeting. There are kisses of joy, of love and endearment, of passion and lust, of commitment and comfort, of social grace and necessity, of sorrow and supplication. The Romans, in fact, created a typology of kisses, with Osculum referring to a social or friendship kiss, or kiss out of respect, Basium, which referred to an affectionate kiss for family members, and Savium, which was a sexual or erotic kiss. To indicate its importance in German culture, we find that the German language has words for 30 different kinds of kisses, including nachküssen, which is defined as a kiss "making up for kisses that have been omitted.” And if we were to trace the kiss through history, we would find that an individual’s social standing determined where to kiss another person in greeting. Kisses moved from the lips downward as kissers moved down the social hierarchy. Kissing feet, for example, was customary throughout the Middle Ages. A Kiss was a sign of trust between feudal lords and vassals. A Kiss was a legal way to seal contracts (“sealed with a kiss”) There are also fundamental cultural differences among industrialized nations. In Finland, people tend to be more private and rarely kiss in public. In Japan, since kissing is associated more with sex, a public display is considered inappropriate – even vulgar. In the United Kingdom, people are more likely to shake hands. Although the “French kiss” entered the English vocabulary in 1923, according to Alfred Kinsey, kissing style was found to correlate with a person’s level of education. Seventy percent of well-educated men admitted to French kissing, while only 40 percent of those who dropped out of high school did. Still, judging from a quick look at popular culture, Americans appear to be rather interested in kissing. |
|
Last, social scientists investigating kissing note important differences between women and men, the former placing more value on the experience of kissing and being more likely to see kissing as a good way to assess a potential mate. I hope that this brief detour into kissing has illustrated the main point I made earlier: that different perspectives – in this case different perspectives associated with different disciplines – can each have something important to contribute to our understanding of the same phenomenon. One is not necessarily “better” or “more true” than the others, each has a legitimate though different point of view. These perspectives are not in conflict with one another in the sense that if one is right the other is wrong. They are best seen, instead, as complementary and mutually enriching. But let’s back up for a minute – thus far we’ve only mentioned how a perspective guides your way of seeing. We need to take seriously the “not seeing” part of the Burke theorem, because this is extremely important. All too often people have their “pet” theories and think that it – and it alone – is sufficient to account for things. |
“Maslow’s Hammer” |
Abraham Maslow 1908 - 1970 |
|
“Believing is Seeing” |
We have all heard the phrase “seeing is believing” and, in fact, there are times when this phrase serves us well. But now I’d like you to consider the opposite: that “believing is seeing.” What is meant here is that in many cases what a persons thinks they see corresponds to a picture they already have in their head. Look, for example at this picture. |
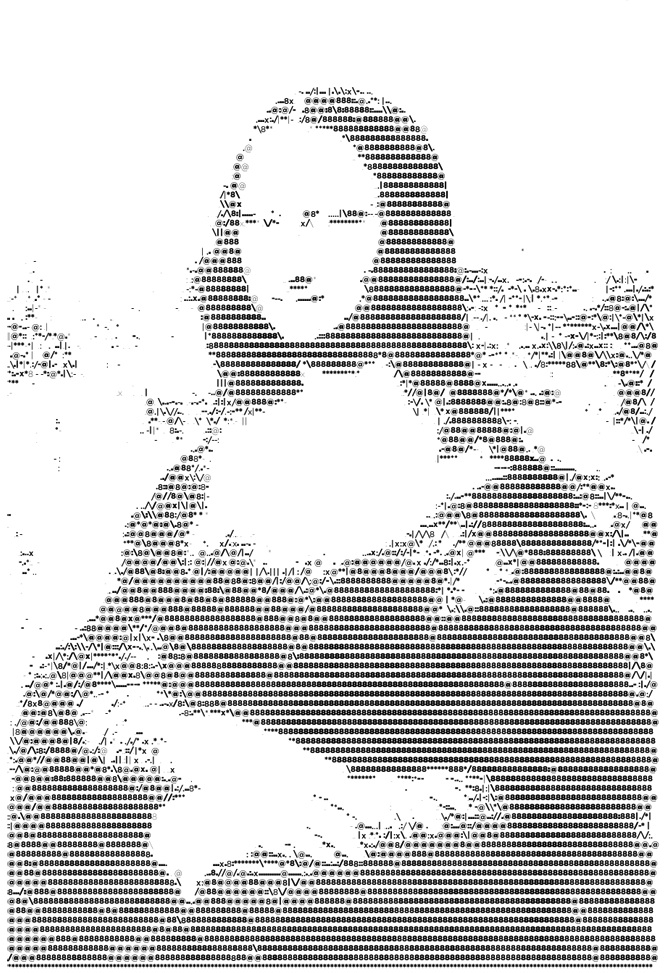
Do you recognize the painting? If you have ever seen Da Vinci’s “Mona Lisa” – it is, after all, the most recognized piece of art in the world (for interesting reasons we will get to later in the semester) – you will immediately recognize it here because you already know what it looks like. The image is already in your head and you fill in the missing blanks. Now look at this next slide. |
Do you see anything? If not, move back a few feet from the screen and look again. Many people – not everyone – sees a rather large face. In fact, many see a particular face – the face of Jesus. Others see Charles Manson. The slide is actually a satellite image of a mountain range in China, so if you did see a face and interpreted it as a particular face, it, too, was because you already had that picture in your head – it corresponded to a belief that you held. This next slide is a random series of blotches. Do you see the Dalmatian? |
If you have never seen a Dalmatian before – if you didn’t believe in their existence – you never would have seen it here. Or how about this: the Nun in a bun? |
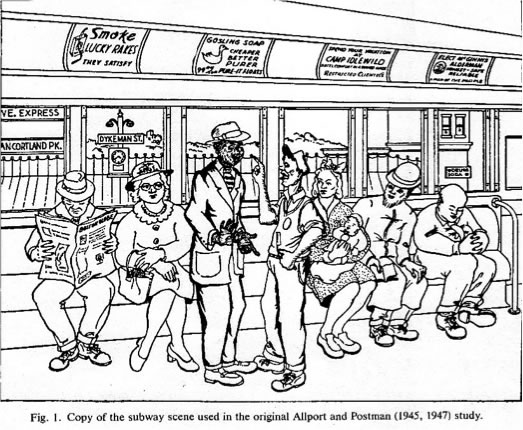
But this next one is more serious. Look at this slide depicting two men in the foreground standing facing each other on a public train. |
Allport and Postman showed this slide – for a fraction of a second – to people in the 1940s and asked them to describe what they saw. As you can see, the taller gentleman wearing a suit and tie – looking like a businessman – is dark-skinned and the shorter gentleman, dressed in workman’s clothing and holding a razor, is light skinned. But, remember: this is during the 1940s and if you were to ask most people which of the two men – the dark or light skinned man – was more likely to be dressed in a suit or which of the two men – the dark or light skinned man – was more likely to be holding a weapon, what do you think they would say? What do you think corresponded with their beliefs? And, in fact, when viewing this picture for an instant many “reversed the races” when they described what they saw. Some actually reported that the scene showed a dark-skinned man attacking a light skinned businessman in full view of others. As you might guess, this has important implications for studies of eyewitness accounts, stereotypes, prejudice, and discrimination. It also shows how one’s prior beliefs and attitudes can affect what one thinks they are seeing. A way of seeing is also a way of not seeing. |
“Seeing can be Deceiving” |
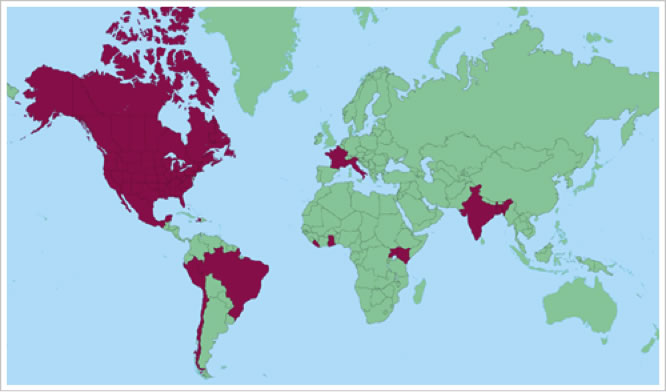
But there is more. Seeing can also be deceiving. Let me begin with something simple: maps. Here’s an image of a map of the world we all grew up with: it’s called a Mercater Map. There’s the United States, looming large, in the top left quadrant of the map. We do, after all, read from left to right and being on top is certainly better than being on the bottom . . . |
Now look at a Peter’s Map where the size of each continent is proportional to the others. Notice anything? |
Look at Greenland, which is .8 million square miles, and Africa, which, at 11.6 million square miles, is nearly fifteen times larger than Greenland . |
Or look at Greenland, which is .8 million square miles, and China, which, at 3.7 million square miles, is more than four times larger. |
Or look at the former Soviet Union, which is 8.7 million square miles – only three-quarters the size of Africa which is 11.6 million square miles. |
Or, last, look at Europe, which is 3.8 million square miles, and South America which is nearly twice as large with 6.9 million square miles. |
Do you notice a pattern here? Do some continents and countries, portrayed as being larger, appear more important than others? Are our views tainted by the ways certain countries and areas are portrayed? And, of course, what about this map of the world? |
Or this one? You know, of course, that there is no up or down in space. |
But let’s look at something closer to home – something that has serious political consequences. Much has been made of the so-called “culture wars” and whether we live in “red” or “blue” states and I suspect that you have probably seen this map before, clearly showing that the United States is red-blooded Republican and that there is a wide gulf between the two parties. And it is true that in the 2004 Presidential election, a majority of people in those states colored in red voted for the Republican candidate while in those states colored in blue a majority voted for the Democratic candidate. (This work was done by Michael Gastner, Cosma Shalizi, and Mark Newman, at the University of Michigan.) |
But what if we re-size the states and make them proportional to their population? Now what does it look like? It’s still looks like there’s more red than blue, but not nearly as much of a difference as shown in the previous slide. |
Now let’s see what happens when we drill down to the county level. The first map, as before, looks overwhelmingly “red,” . . . |
. . . the second map, scaled to population, not so much. |
Last, consider those counties where the votes were close – within two percentage points (51%-49%) – and color them purple. Here’s the typical map. |
Here’s the map re-sized proportionally to reflect differences in population. |
Now look one last time at the first and last slides side by side. Is the one on the left – the one we typically see – offering an accurate view or one that is deceiving? Is there really that wide a gulf between people? |
“Seeing can be Deceiving” – Poverty in the United States |
But let me offer another example of how seeing can be deceiving, one that is clearly of sociological interest and something we will cover in detail later in the semester: poverty. According to some political commentators – as well as to some ordinary citizens – America has a permanent underclass of unproductive citizens who prefer to live on welfare. They do not take personal responsibility for their situation and they are unwilling to make the effort to lift themselves up out of their circumstances. They remain in poverty by choice. Moreover, the argument goes, federal spending on entitlements and other mandatory programs through which individuals receive benefits is promoting laziness, creating a dependent class of Americans who are losing the desire to work and would rather collect government benefits than find a job. And since their children receive little educational encouragement at home they become stuck in a cultural setting that destroys their work ethic and they grow up to be copies of their parents thereby perpetuating the existence of this underclass. Unfortunately, such people do exist in the United States. They are the toughest challenge for policymakers because almost nothing about their lives equips them to escape from poverty and the circumstances that surround them. And these people are visible – we see them on the street corners in inner cities and on the news. But what percentage of those living under the poverty line and receiving benefits falls into this category? In 2010, 15.1 percent of all persons lived in poverty. This amounts to roughly 46.2 million people. |
|
According to the U.S. Bureau of Labor statistics, 10.4 million of the 46.2 million people living below the poverty line – that’s 22.5% - are “the working poor” – people who spent at least 27 weeks in the labor force. These are people who, despite working, remain poor because they hold menial, dead-end jobs that have no benefits and pay the minimum wage or below. The federal minimum wage, which is set at $7.25 an hour, adds up to only $14,500 for full-time work (before taxes). It takes $9.55 an hour for a full-time worker to earn enough money to reach the poverty level for a family of three. It takes $11.52 an hour for a full-time worker to earn enough money to reach the poverty level for a family of four. To give you some sense of who we’re talking about, consider that the two million Americans working in nursing homes – people we ask to look after our loved ones – earn, on average, between $7 and $8 an hour. And the median wage of the estimated 2.3 million child-care workers is $6.60 an hour, usually without benefits. |
The Disreputable Poor |
But this is not who many think about when they think about the poor. They think about the more visible segment of the poor population – the “disreputable poor” who appear lazy and who must be “working the system” or those who simply aren’t taking personal responsibility for their situation and just looking for a government handout. Perhaps this is why, when asked what, in their opinion, were major causes of poverty, more than half of those surveyed answered “a decline in moral values” and “poor people’s lack of motivation.” |
And as you might guess, one’s political affiliation – that is to say, one’s political perspective – affects what one focuses upon and then what one actually sees. To think, however, that the disreputable poor, because they are most visible, are representative of the majority of those living below the poverty line can have serious consequences when it comes to policy decisions. Seeing, here, is deceiving. |
Now, in some cases, thinking just short-circuits – like when some people argue that receiving government benefits puts people on easy street. Here, we can simply look at government figures. |
As this slide shows, the maximum monthly benefits for a family of three living in Texas that reports no income of their own received $188 a month in 1996 and 1998 through the Aid to Families with Dependent Children Program – commonly known as “welfare” – and $201 in the year 2000 through the Temporary Assistance to Needy Families program when welfare was reformed. You see the comparable median dollar amounts for the rest of the United States on the right. You will be looking at the most recent data later this semester. You can also see that in 2000 the monthly food stamp allowance was $75.98 in Texas. For the year, then, this family would receive $5,147.28 in benefits for the year – or a little more than one-third of what it took to reach the poverty line that year. Does this appear to indicate that this family is on easy street and living large? |
“Getting Something for Nothing” |
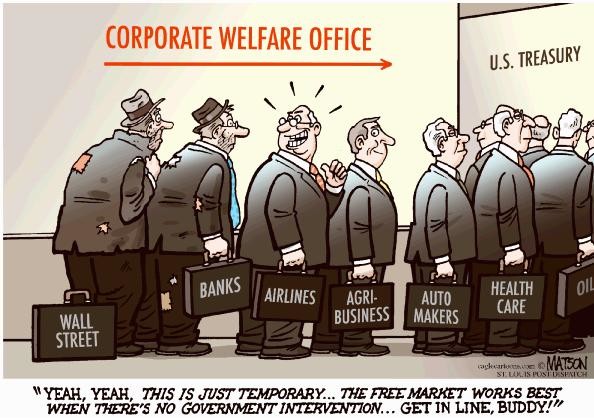
Now, you still might argue that they shouldn’t get anything – that you work hard for your money and that they are getting “something for nothing.” Of course, a majority of the people collecting these benefits have paid into the system when they were working, just as you might be doing now (remember we’re not mistaking the disreputable poor for all of those receiving benefits). But who else gets money from the government – what some economists refer to as entitlements? Remember the Burke Theorem: A way of seeing is also a way of not seeing. |
Do any of you live in a house – or your parents’ house? Who owns it? Typically, the bank owns it and you or your parents are paying a mortgage. And the way things are set up, homeowners can claim the interest that they pay on their home loan as a tax deduction each year until the loan is paid off. And a larger tax deduction means a larger tax refund from the government. So, look at this table – once again from the year 2000, when mortgage rates were around 7 percent. And let’s assume that you are well-off financially and in an upper tax bracket – 30%. You can see the loan amount in the left column, the amount of interest paid the first year of the mortgage (it gets reduced little by little over the course of paying off the loan) in the center column, and the amount of money your owed taxes are reduced in the right column. |
This shows that if you bought a house for, say, $300,000 with your down payment reducing your loan to $250,000, you would get more from the government than did that family of three living in Texas. And you must be doing fairly well to afford this house and be able to put up $50,000 as your down payment. And the more expensive your house – and the greater your loan – the more money stays in your pocket. For what? Aren’t homeowners also getting something for nothing? Sure, they worked hard but, in return, they got paid a good salary. Why should they get the added bonus and get more for spending their money? The federal government spent roughly $33 billion on TANF and MOE programs in 2012. Federal expenditures on home ownership mortgage deductions in 2012 was nearly four times greater at $131 billion. But for some reason people still might think that successful people are more deserving – or perhaps that less successful people are simply not deserving at all. |
Drug Testing to Receive Government Aid |
This has recently come up in another context. Here in Texas there is a bill pending that would require drug tests for anyone receiving government assistance to make sure that the money goes for what it is intended for. Fine. But will students be drug tested before they can receive a Federal Pell Grant? Homeowners for their tax entitlements? Corporate executives before they receive tax breaks? By the way, when a program similar to this was run in Michigan, what percentage of those seeking public assistance do you think failed the test? It was 8%. How many of you would say that 8% or more of your friends would fail this test if they had to take it today? |
A Double Standard: Absolving the Rich while Demonizing the Poor |
The point, of course, is that those in more prominent positions would not be asked to submit to such a test. There is a double standard. There is a marked tendency to absolve the rich while demonizing the poor. Some things – based on our perspectives – are easily seen, while other things escape our notice. “Everyone knows,” for example, that people cheat on welfare. You have probably heard of the Cadillac driving welfare queens who defraud the government. |
Why is this myth so readily accepted as real? According to most government and private sector reports, welfare fraud is rare – it is estimated to be in the 3% range. Back in 1996 Governor Pataki in New York instituted a “finger imaging” program to weed out welfare cheats and did, in fact detect roughly 25,000 cases. But this is only 3.4% of the 747,000 cases at the time. In Los Angeles they discovered fraud or misrepresentation in 10,789 cases in 2005, which was less than 1% of the 1.5 million residents collecting welfare at that time. Actually, a large percentage of those instances where fraud or misrepresentation occurs are not perpetrated by non-working recipients living solely on government benefits. Instead, it’s recipients that are working part-time in order to supplement the benefits they receive which, as shown a moment ago, are not sufficient to get people up to the poverty line. They often do not report the added income, knowing that if they did so, their benefits would be reduced. This is not to condone such behavior. I mention this because while people tend to rail against these “welfare cheaters” – and remember that the percentage of welfare recipients who cheat is around 3 percent – folks that routinely cheat on the federal income tax returns do not invoke the same critical response. In fact, according to the 2012 Taxpayer Attitude Survey conducted for the IRS Oversight Board 15% of taxpayers admit to fudging their tax returns, 8% reported that it was OK to cheat “a little here and there” and 4% agreed that it was OK to cheat “as much as possible.” And according to IRS figures, 14 cents of every dollar owed in federal taxes is never paid. The costs of underreporting income, fabricating deductions, and “fudging” numbers costs the government close to $300 billion last year. Let me remind you that the entire expenditure for Temporary Assistance to Needy Families was roughly $35 billion, which amounts to roughly one-tenth of the amount of money that taxpayers defrauded the government. And while welfare fraud hovers at around 3% – five times as many taxpayers report that they cheat. |
“Street” and “Suite” Crime |
As shall be seen later in the semester when we cover crime in America, we will find more of the same. When asked to picture a criminal in their mind, most people tend to think of someone committing a “street” crime rather than a “suite” crime. Most people think of someone who is poor and lives in the inner city rather than someone wearing a three-piece suit. But the numbers are clear: The FBI estimates, for example, that burglary and robbery – street crimes – costs the nation roughly $3.8 billion a year. Corporate crime costs hundreds of billions each year. It is not just those cases – like Enron – that made headlines. Even smaller categories, such as auto repair fraud, costs upwards of $50 billion a year. Now one might argue that there are not as serious as street crimes – that they are non-violent crimes. All well and good. But consider that according to FBI statistics roughly 19,000 Americans are murdered each year, and compare this to the estimated 56,000 Americans who die each year due to corporate evasions of various laws having to do with pollution, occupational hazards, product liability, and so on. |
Conclusion |
Sociology – as a perspective – will force your attention on such matters – it will broaden your outlook on life. At the very least it should give you things to think about – and, hopefully, to argue about. Having read this lecture, some of you might think that, through my use of certain examples, that I displayed a particular bias. If so – great! This means that you are recognizing that perspectives are everywhere – that they guide what we see and what we think about what we see. And throughout the semester, I will be providing you with a number of perspectives that exist within the discipline of sociology. We’re not all the same. But before we go on to next week’s materials – what sociology is and how it developed, we have one more task. What are the different disciplinary perspectives on this fundamental question - which is the starting point for all inquiry: “What is a Human Being?" For this, you need to go read the second lecture in this unit. |
Copyright 2013, Larry Stern
All material on this webpage is for Collin College class use only. Any unauthorized duplication or distribution is prohibited.